Demographic transition
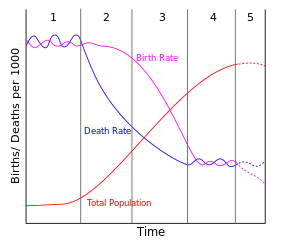
- Countries pass through different stages of population growth as shown in the five stages of the demographic transition model
| Stage | Characteristics | Examples |
|---|---|---|
| 1 | Death rate is high & fluctuating due to disease, famine, war and a lack of healthcare Birth rate is high & fluctuating due to a lack of birth control This causes little natural change |
Remote rainforest tribes in Amazonia & Indonesia The UK before the start of the Industrial Revolution in about 1760 |
| 2 | Death rate falls due to improvements in health care and food supply Birth rate remains high This cause natural increase to rise |
Afghanistan The UK during the Industrial Revolution from around 1760 to 1880 |
| 3 | Death rate continues falling but at a slowing rate Birth rate falls due to the availability of birth control and social & economic changes that make it more beneficial to have smaller families This causes natural increase to fall |
Most LEDCs The UK between around 1880 & 1940 |
| 4 | Death rate is low & fluctuating Birth rate is low & fluctuating, usually according to economic situation This causes little natural change |
Most MEDCs The UK after around 1940 |
| 5 | Death rate rises due to an ageing population Birth rate falls as it becomes more common to postpone motherhood This causes natural decrease to increase |
Japan, Germany, Italy and many eastern European countries |